OpenCV Basics
Note
We assume that by now you have already read the previous tutorials. If not, please check previous tutorials at http://opencv-java-tutorials.readthedocs.org/en/latest/index.html. You can also find the source code and resources at https://github.com/opencv-java/
What we will do in this tutorial
- In this guide, we will:
- Create a basic checkbox interaction to alter the color of the video stream.
- Add a basic checkbox interaction to “alpha over” a logo to the video stream.
- Display the video stream histogram (both one and three channels).
Getting started
For this tutorial we can create a new JavaFX project and build a scene as the one realized in the previous one. So we’ve got a window with a border pane in which:
- in the BOTTOM we have a button inside a HBox:
<HBox alignment="CENTER" >
   <padding>
      <Insets top="25" right="25" bottom="25" left="25"/>
   </padding>
   <Button fx:id="button" alignment="center" text="Start camera" onAction="#startCamera" />
</HBox>
- in the CENTER we have a ImageView:
<ImageView fx:id="currentFrame" />
Color channel checkbox
Let’s open our fxml file with Scene Builder and add to the RIGHT field of our BorderPane a vertical box VBox. A VBox lays out its children in a single vertical column. If the VBox has a border and/or padding set, then the contents will be layed out within those insets. Also it will resize children (if resizable) to their preferred heights and uses its fillWidth property to determine whether to resize their widths to fill its own width or keep their widths to their preferred (fillWidth defaults to true).
A HBox works just like a VBox but it lays out its children horizontally instead of vertically.
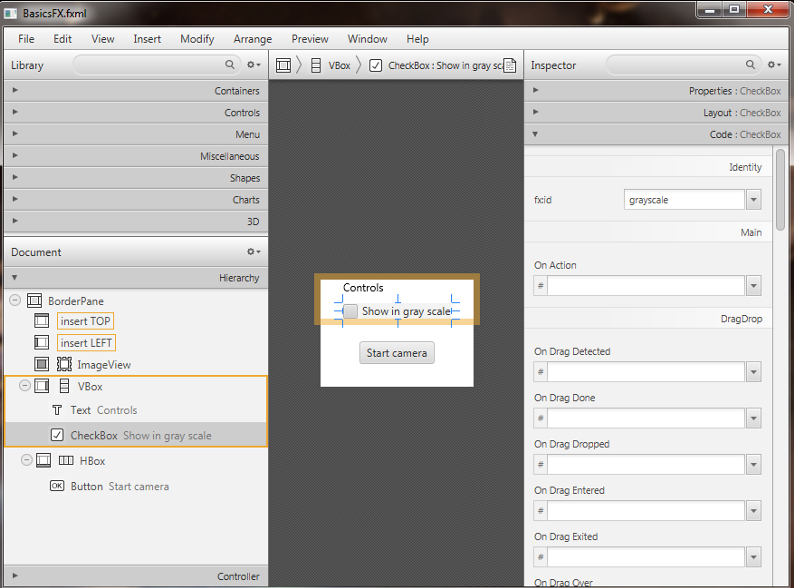
Now we can put inside the VBox a new checkbox, change its text to “Show in gray scale”, and set an id (e.g., “grayscale”).
<CheckBox fx:id="grayscale" text="Show in gray scale" />
Let’s also add a title to this section by putting a text before our new checkbox, but still inside the VBox. Then, set its text to “Controls” (we can find the text element under the Shapes menu).
<Text text="Controls" />
In the Scene Builder we now have:
The graphic interface is complete for the first task, now we need to work on the controller; in the previous tutorial we could control the number of channels displayed on screen with the line:
Imgproc.cvtColor(frame, frame, Imgproc.COLOR_BGR2GRAY);
In order to control this conversion with the check box, we have to link the check box with a FXML variable:
@FXML
private CheckBox grayscale;
Now we can implement the control by adding a simple “if” condition which will perform the conversion only if our check box is checked:
if (grayscale.isSelected())
{
   Imgproc.cvtColor(frame, frame, Imgproc.COLOR_BGR2GRAY);
}
Load an Image and Add it to the Stream
The next step is to add another check box which, if checked, will trigger the display of an image over the camera stream.
Let’s start by adding the image to the project; create a new folder in the root directory of your project and put the image in there.
In my project I have a resources folder with a Poli.png image.
Go back to Eclipse and refresh your project (you should have the new folder in it).
Let’s open the FXML file with Scene Builder and add a new checkbox below the one that controls the stream colors; we have to set the text, the name of the method in the OnAction field and an id.
In the code we will have for example:
<CheckBox fx:id="logoCheckBox" text="Show logo" onAction="#loadLogo" />
In the controller file we have to define a new variable associated with the checkbox, the method set on the OnAction field and adapt the code so that it will display the logo when the checkbox is checked and the stream is on.
Variable:
@FXML
private CheckBox logoCheckBox;
loadLogo method:
In this method we are going to load the image whenever the logoCheckBox id selected (checked).
In order to load the image we have to use a basic OpenCV function: imread.
It returns a Mat and takes the path of the image and a flag (> 0 RGB image, =0 grayscale, <0 with the alpha channel).
@FXML
protected void loadLogo()
{
 if (logoCheckBox.isSelected())
    this.logo = Imgcodecs.imread("resources/Poli.png");
}
Adapt the code.
We are going to add some variants to the code in order to display our logo in a specific region of the stream. This means that for each frame capture, before the image could be converted into 1 or 3 channels, we have to set a ROI (region of interest) in which we want to place the logo. Usually a ROI of an image is a portion of it, we can define the ROI as a Rect object. Rect is a template class for 2D rectangles, described by the following parameters:
- Coordinates of the top-left corner. This is a default interpretation of Rect.x and Rect.y in OpenCV. Though, in your algorithms you may count x and y from the bottom-left corner.
- Rectangle width and height.
Rect roi = new Rect(frame.cols()-logo.cols(), frame.rows()-logo.rows(), logo.cols(), logo.rows());
Then we have to take control of our Mat’s ROI, by doing so we are able to “add” our logo in the disired area of the frame defined by the ROI.
Mat imageROI = frame.submat(roi);
We had to make this operation because we can only “add” Mats with the same sizes; but how can we “add” two Mat together? We have to keep in mind that our logo could have 4 channels (RGB + alpha). So we could use two functions: addWeighted or copyTo.
The addWeighted function calculates the weighted sum of two arrays as follows:
dst(I)= saturate(src1(I) alpha + src2(I)* beta + gamma)*
where I is a multi-dimensional index of array elements. In case of multi-channel arrays, each channel is processed independently. The function can be replaced with a matrix expression:
dst = src1*alpha + src2*beta + gamma
Note
Saturation is not applied when the output array has the depth CV_32S. You may even get result of an incorrect sign in the case of overflow.
- Parameters:
- src1 first input array.
- alpha weight of the first array elements.
- src2 second input array of the same size and channel number as src1.
- beta weight of the second array elements.
- gamma scalar added to each sum.
- dst output array that has the same size and number of channels as the input arrays.
So we’ll have:
Core.addWeighted(imageROI, 1.0, logo, 0.7, 0.0, imageROI);
The second method (copyTo) simply copies a Mat into the other. We’ll have:
Mat mask = logo.clone();
logo.copyTo(imageROI, mask);
Everything we have done so far to add the logo to the image has to perform only IF our checkbox is check and the image loading process has ended successfully. So we have to add an if condition:
if (logoCheckBox.isSelected() && this.logo != null)
{
    Rect roi = new Rect(frame.cols() - logo.cols(), frame.rows() - logo.rows(), logo.cols(),logo.rows());
    Mat imageROI = frame.submat(roi);
    // add the logo: method #1

    Core.addWeighted(imageROI, 1.0, logo, 0.7, 0.0, imageROI);
    // add the logo: method #2
    // Mat mask = logo.clone();
    // logo.copyTo(imageROI, mask);
}
Calculate a Histogram
A histogram is a collected counts of data organized into a set of predefined bins. In our case the data represents the intensity of the pixel so it will have a range like (0, 256).
- Since we know that the range of information value, we can segment our range in subparts (called bins); let’s identify some parts of the histogram:
- dims: The number of parameters you want to collect data of.
- bins: It is the number of subdivisions in each dim. In our example, bins = 256
- range: The limits for the values to be measured. In this case: range = [0,255]
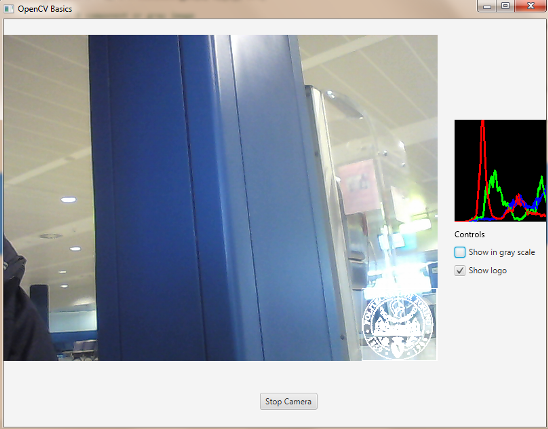
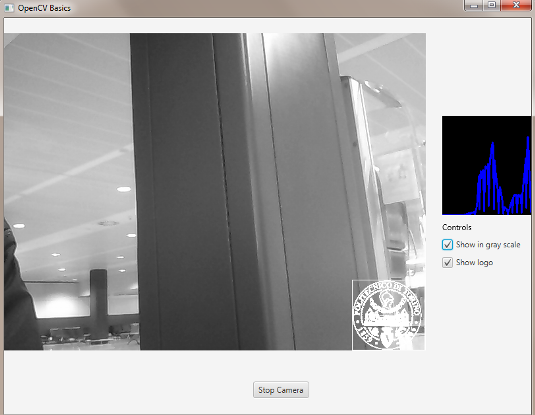
Our last goal is to display the histogram of the video stream for either RGB or in grayscale. For this task we are going to define a method in our controller class that takes a Mat (our current frame) and a boolean that will flag if the frame is in RGB or in grayscale, for example:
First thing we need to do is to divide the frame into other n frames, where n represents the number of channels of which our frame is composed. To do so we need to use the Core.split function; it needs a source Mat and a List<Mat> where to put the different channels. Obviously if the frame is in grayscale the list will have just one element.
Before we could calculate the histogram of each channel we have to prepare all the inputs that the calcHist function needs.
The functions calcHist calculates the histogram of one or more arrays. The elements of a tuple used to increment a histogram bin are taken from the corresponding input arrays at the same location.
Parameters:
- images Source arrays. They all should have the same depth, CV_8U or CV_32F, and the same size. Each of them can have an arbitrary number of channels.
- channels List of the dims channels used to compute the histogram. The first array channels are numerated from 0 to images[0].channels()-1, the second array channels are counted from images[0].channels() to images[0].channels() + images[1].channels()-1, and so on.
- mask Optional mask. If the matrix is not empty, it must be an 8-bit array of the same size as images[i]. The non-zero mask elements mark the array elements counted in the histogram.
- hist Output histogram, which is a dense or sparse dims -dimensional array.
- histSize Array of histogram sizes in each dimension.
- ranges Array of the dims arrays of the histogram bin boundaries in each dimension. When the histogram is uniform (uniform =true), then for each dimension i it is enough to specify the lower (inclusive) boundary L_0 of the 0-th histogram bin and the upper (exclusive) boundary U_(histSize[i]-1) for the last histogram bin histSize[i]-1. That is, in case of a uniform histogram each of ranges[i] is an array of 2 elements. When the histogram is not uniform (uniform=false), then each of ranges[i] contains histSize[i]+1 elements: L_0, U_0=L_1, U_1=L_2,..., U_(histSize[i]-2)=L_(histSize[i]-1), U_(histSize[i]-1). The array elements, that are not between L_0 and U_(histSize[i]-1), are not counted in the histogram.
- accumulate Accumulation flag. If it is set, the histogram is not cleared in the beginning when it is allocated. This feature enables you to compute a single histogram from several sets of arrays, or to update the histogram in time.
The image will be our frame, we don’t need a mask and the last flag will be false; thus we need to define the channels, the hist, the histSize and the ranges:
In the RGB case we will need all of the hist defined, in the grayscale case instead we will use just the hist_b one.
We are now ready to do the histogram calculation:
where gray is the flag we passed to the showHistogram method.
Draw the Histogram
Next step is to draw the calculated histogram in our GUI. Open the fxml file with Scene Builder and add an ImageView above the “Controls” text in the right of the BP and set its id:
<ImageView fx:id="histogram" />
Now back to the Controller class. Let’s add a global variable to control the just added image view:
@FXML
private ImageView histogram;
and continue to write the showHistogram method.
First thing first, let’s create an image to display the histogram:
int hist_w = 150;
int hist_h = 150;
int bin_w = (int) Math.round(hist_w / histSize.get(0, 0)[0]);
Mat histImage = new Mat(hist_h, hist_w, CvType.CV_8UC3, new Scalar(0, 0, 0));
before drawing, we first normalize the histogram so its values fall in the range indicated by the parameters entered:
Core.normalize(hist_b, hist_b, 0, histImage.rows(), Core.NORM_MINMAX, -1, new Mat());
if (!gray){
   Core.normalize(hist_g, hist_g, 0, histImage.rows(), Core.NORM_MINMAX, -1, new Mat());
   Core.normalize(hist_r, hist_r, 0, histImage.rows(), Core.NORM_MINMAX, -1, new Mat());
}
Now we can draw the histogram in our Mat:
for (int i = 1; i < histSize.get(0, 0)[0]; i++){
   Imgproc.line(histImage, new Point(bin_w * (i - 1), hist_h - Math.round(hist_b.get(i - 1, 0)[0])), new Point(bin_w * (i), hist_h - Math.round(hist_b.get(i, 0)[0])), new Scalar(255, 0, 0), 2, 8, 0);
   if (!gray){
      Imgproc.line(histImage, new Point(bin_w * (i - 1), hist_h - Math.round(hist_g.get(i - 1, 0)[0])),new Point(bin_w * (i), hist_h - Math.round(hist_g.get(i, 0)[0])), new Scalar(0, 255, 0), 2, 8, 0);
      Imgproc.line(histImage, new Point(bin_w * (i - 1), hist_h - Math.round(hist_r.get(i - 1, 0)[0])),Math.round(hist_r.get(i, 0)[0])), new Scalar(0, 0, 255), 2, 8, 0);
   }
}
Let’s convert the obtained Mat to an Image with our method mat2Image and update the ImageView with the returned Image:
histo = mat2Image(histImage);
histogram.setImage(histo);
The source code of the entire tutorial is available on GitHub.